
Introduction
In the creation of online courses, using Google Analytics is not just an option; it’s a necessity. Online course creators face unique challenges when it comes to measuring and growing their courses, engaging with their community, and optimizing their teacher websites. This is where Google Analytics comes into play, offering invaluable insights and data-driven solutions to help online course creators thrive in the competitive online education landscape.
In this lesson, we’re going to learn about Google Analytics, the next version called GA4, so that you can measure and grow your courses, your community, and your teacher website. We’ll go over the latest Google Analytics called GA4, what it is, why you should use it, how to use it, an example, and a recap.
Challenges online course creators can face if they don’t use google analytics:
- Difficulty in understanding where website traffic is coming from and how visitors are finding the course.
- The sizing of elements can cause issues, with some appearing disproportionately large while others may become minuscule.
- Limited insights into the effectiveness of marketing efforts and ROI.
- Lack of visibility on user behavior and conversion rates.
- Missed opportunities to identify and target specific audience segments.
Video Lesson – Learn How GA4 Can Help Teachers in their Online Course
Who Can Use It?
Almost any kind of teacher, professional, or coach can use Google Analytics to analyze user behavior, track conversions, and monitor website traffic sources across their various platforms.
Here are some examples of how teachers helping creative students can use Google Analytics:
- Track page views and user engagement metrics.
- Analyze user flow and behavior to optimize the user experience within the course.
- Analyze referral traffic sources to understand which platforms are driving the most traffic to their website.
This can work for a wide range of educational businesses like UI designing, graphics designing, and blogging.
What Is Google Analytics?
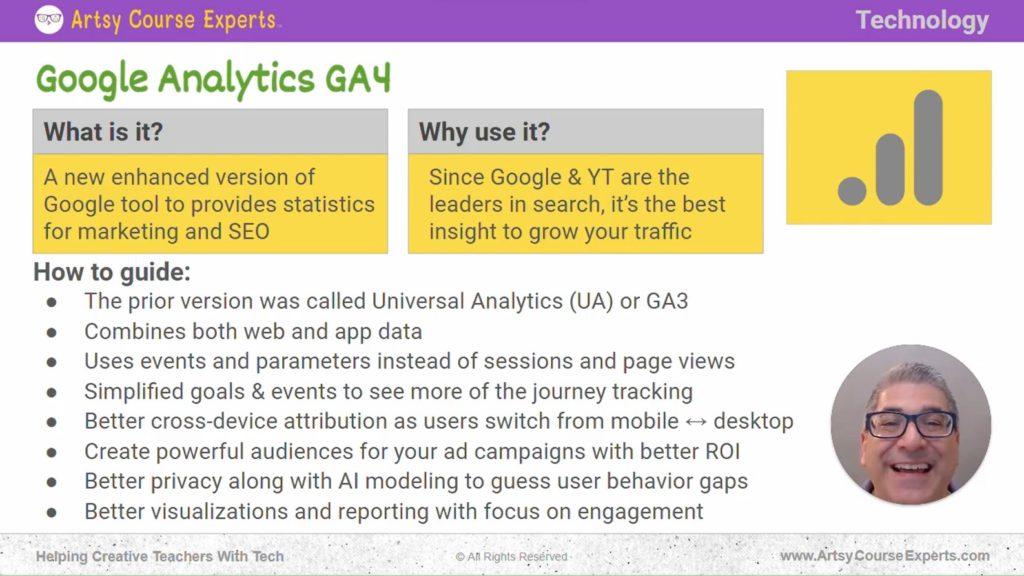
Google Analytics is an enhanced version by Google designed to provides statistics for marketing and SEO (search engine optimization). It allows you to track various aspects of your website or app, including the number of visitors, their devices, geographical locations, and their navigation paths. This powerful tool provides insights into user actions and the time they spend on each section of your site.
Why Use Google Analytics?
Since Google and YouTube being the leaders in search (Google owns YouTube) makes Google Analytics the best tool to gather information about how people find your website and what they do once they are on it.
Using Google Analytics will help you understand the sources of your website traffic and people are coming from. It will determine how they much time visitors spend on your website and track conversions and assess whether users are buying your services. For instance, it shows what they did on your sales page, what they did on your blog or community, and what they clicked, etc.
Google Analytics gives great information so that you can tweak your business, change your ads, change your SEO, add more content, etc. The GA4 version is the latest and greatest version and we’ll go into that.
How To Guide For Analytics
Let’s delve into how G4 works and how it can help online course teachers measure their progress online.
The Prior Version Was Called Universal Analytics (UA) Or GA3
The prior version was called Universal Analytics, code name UA or GA3, while the new version is called GA4; Google Analytics, version four.
Combines Both Web and App Data
The main advantage is that it combines the web and the application data. It is noteworthy that lots of websites are not only on the desktop but on mobile devices. All this data is now seamlessly integrated.
Uses Events and Parameters
The GA4 system employs events and parameters instead of sessions and page views. This provides teachers with deeper insights as they monitor their progress.
Simplified Goals & Events
In the past, Google Analytics and many other analytics tools would log when a visitor first arrived on your website, initiating a session. The visitor would receive a cookie, navigate around your website, and interact with certain pages.
Now, the focus has shifted to events—tracking what users do, where they click, which pages they view, and when they exit. It’s akin to new engine, while you will get a lot of the same data, it offers more insightful information across various applications and user activities.
Better Cross-Device Attribution
One of the most significant improvements is cross-device attribution, allowing you to gain a comprehensive view of your customers as they transition from mobile to desktop.
If a user is on mobile, they’re clicking around, they like something, they may decide to see more on that and continue searching with their desktop browser; They’re switching between the mobile browser or the mobile app and the desktop app or the desktop browser or tablet. With Google Analytics, you gain a much clearer picture of where they’re spending their time and the journey they’re taking with your content.
Create Powerful Audiences for Your Ads with Better ROI
Another enhancement in the new Google Analytics is the understanding your of ad campaigns.
Whether you’re using Google Ads on a different platform or utilizing a different ad system, all ads are tracked. However, the latest Google Analytics version enables you to discern which ads have the most impact and offer a better return on investment. Remember, there are all sorts of advanced features behind the scenes, like retargeting, which is once they visit your website and they see an ad, and then maybe later they go to other websites for some number of weeks afterward.
They will potentially see your ads even though they’re on a different property; that’s the retargeting feature. Google Analytics, along with the Google Ads retargeting feature, is going to be very powerful. The Google Analytics user interface makes that all visible so that you can see how all these pieces are coming together.
Better Privacy Along with Al Modeling
Google, in general, is continuing to improve its privacy. Various people in different countries choose not to accept cookies or maybe prefer that certain data should not be collected about them.
In addition to that, Google Analytics is providing the ability to use AI and machine learning to better understand what is happening in certain gaps that maybe Google Analytics didn’t collect. Let’s say people visited your page and maybe they bought something or signed up for an email, Google Analytics will help you try to guess for some of those people that have turned off tracking. Google Analytics will attempt to estimate the actions taken during those intermediate steps, such as page visits or button clicks.
Using AI, you can generate informed guesses and probabilities. This approach combines the best of both worlds: Google’s provision of additional privacy safeguards while helping business owners deduce what occurred during the steps when anonymous viewers engaged with their business.
Better Visualizations and Reporting
Another significant feature and update in Google Analytics pertain to improved visualizations and reporting. These include charts and flowcharts that offer insights into visitor behavior on your website.
A key focus is on engagement. Visitors may explore various sections of your website, such as your course sales page, community pages, or coaching pages. They may take specific actions, spend time on different activities, and interact with various elements. Some may participate in quizzes or consume content in different sections within your community.
They might also navigate back and forth between two or three pages. This could be because they’re undecided, not yet ready to make a purchase, sign up, or submit their phone number. All of these aspects are areas where the latest Google Analytics excels, helping you observe, measure, and make positive changes for your business.
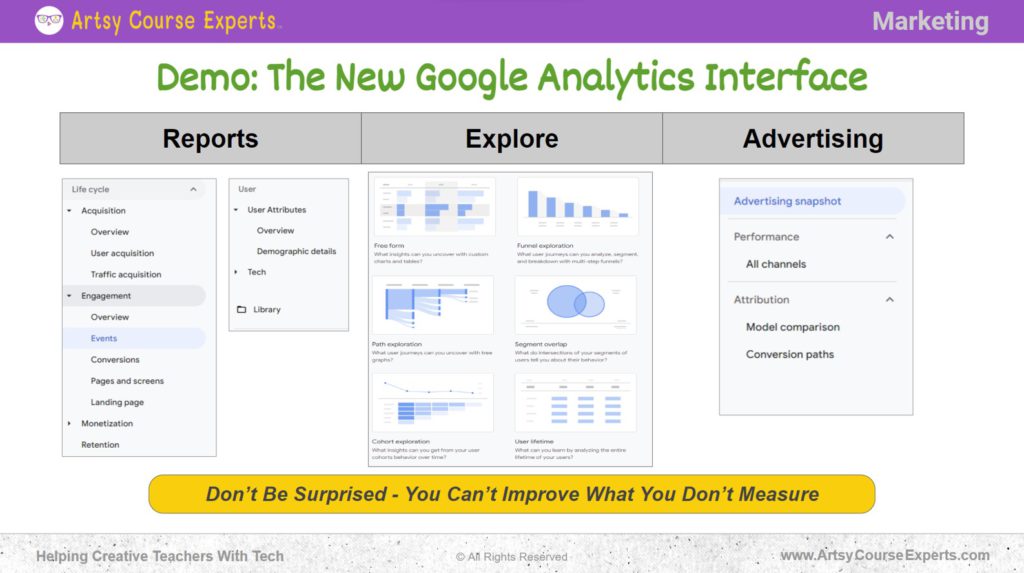
Demo: The New Google Analytics Interface
There are three main features we’ll explore in Google Analytics.
Reports
Acquisition
This is the section where you’re going to see how you’re acquiring new customers. You can see whether they’re arriving through SEO, paid ads, or your affiliate program. This data helps you identify the sources of your users and traffic.
Engagement.
Just as we mentioned before, engagement is a very important factor. Here, you’ll delve into user activities on your properties and determine where they are spending their time. For potential customers who haven’t made a purchase yet, they may find themselves moving back and forth. They could be on the FAQ page or browsing through client testimonials, indicating indecision.
It’s important to note that engagement extends to landing pages. When visitors first land on your website, whether it’s the homepage or a sales page, Google Analytics lets you track their journey, identifying the steps they take or whether they navigate back and forth between pages.
Monetization
This is when they buy the service. They reach the sales page, and perhaps they encounter a popup. They purchased at that point. However, users might encounter something on the page that they didn’t like. This could be the lack of a secure HTTPS connection or difficulty in finding the coupon entry field.
Users
The reporting section also provides you with information about your users. It reveals where they are from and what technology they are using. They could be on a browser, such as Chrome, or Firefox, or accessing your website through a mobile device or tablet. These details allow you to gain insights into the locations of your customers and the languages they speak.
Explore
This is where you can see visualizations of the flows of data as they come in. You filter by a month and then you filter maybe on a certain webpage you want to see what is happening. Exploring lets you see a visualization of the flow of users as they come in and their next steps.
For example, let’s say you have a “leak.” A significant portion—25% of the people visiting a particular page—are simply leaving without proceeding further. You want to understand what led to this situation. Did these 25% of people find the page unsuitable, or were they searching for something they couldn’t find? You might then consider how to modify these pages and buttons to address this issue.
For instance, you could have a single call to action, or you could implement three calls to action—one at the top, one in the middle, and one at the bottom of the page. This way, when users reach the bottom of the page, they have easy access to a call to action.
Alternatively, you could introduce a third call to action at the bottom of the page, providing users with comprehensive information. By adding this third call to action, you may observe that only 15% of the people are leaving. These are the kinds of optimizations that Google Analytics can help you implement.
A/B Testing
You can do some A/B testing and then come back next month and look. You can say, “Okay, I did these changes” then observe what’s happening to the results. You can monitor whether users stay on a page longer, explore other pages on your website, or convert more effectively.
Advertising
Google Analytics provides insights into advertising, including Google Ads, Retargeting, and YouTube ads. They have a lot of powerful advertising features.
Performance
There’s an advertising menu here that lets you see all the statistics on the different parts of the ads, which ads are converting, where these users are coming from, and what most common paths you have your users convert from.
Attribution
From the ad section of Google Analytics, you can gain insights into how users convert, whether it’s directly from an ad or through other interactions with your site.
Frequently Asked Questions About Google Analytics

Summary – Google Analytics
Google Analytics proves to be a useful tool for online course creators seeking to elevate their teaching strategies and drive success in the digital education landscape. Through the power of data-driven insights, course creators can gain a deep understanding of their audience, optimize their courses for better engagement, and make informed decisions to enhance their online teaching businesses.
By incorporating this powerful tool into their teaching arsenal, course creators can navigate the digital landscape with confidence, drive growth, and achieve their goals.
Tips for creative online course creators when using Google Analytics for their courses:
- Upgrade to GA4 if you don’t have the latest version
- Get Google Analytics HTML codes and all your different systems right on your website, course community, and your webinars
- Start tracking all the events that your visitors are doing
- Use custom reports and segments to tailor your analysis to specific metrics or user segments
- Use the conversion tracking feature to measure the actions you want users to take
You should be a little smarter now. Thanks for hanging out!
Please subscribe to get more tips for creative online course teachers.
More Tips For Online Teachers
These lessons can also help you with Operations and Technology: